


Bitcoin has multiple long-term and short-term variables that affect its price, and many folks debate what its major correlations are, if any. It turns out, the same factors that affect bitcoin’s price – real rates of inflation, monetary and fiscal policy and market exuberance – also partially determine to which assets bitcoin is correlated.
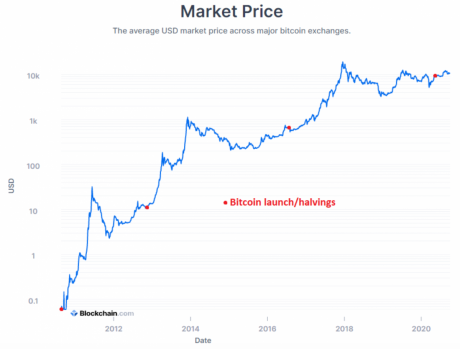
Over the long run since its launch, increasing user adoption, ever-strengthening security and the widening network effect have propelled bitcoin’s market capitalization to greater and greater heights. Those are the long-term variables.
The halving periods tend to act as fundamental catalysts for the next bull market within this long-term trend, as new supply gets cut in half while incoming demand remains robust. As long as that demand indeed remains strong, upward pressure builds on its price, and then when it eventually breaks out, momentum traders hop on board with a new influx of demand and drive it up further.
All pre-programmed halving events occurred during periods where bitcoin had been off from its all-time highs for at least a year, and usually more than one year. On the other hand, the year after a halving has always been great for its price, without exception so far (albeit with a very small sample size), and has eventually led to the next blow-off top and a period of consolidation.
During those long consolidations, bitcoin becomes more correlated to short-term variables related to global liquidity and other risk assets. This becomes especially true as it reaches wider adoption and is invested in by the financial community. Basically, the ongoing debates about the degree to which bitcoin is correlated to other assets would do well to break bitcoin’s price behavior into two phases: bull runs and consolidation periods.
If we look at percent drawdowns in bitcoin compared to drawdowns in the S&P 500, for example, we can see a lot of correlation over the past two years in this consolidation phase, particularly when sharp drawdowns occur and investors broadly de-risk their holdings.
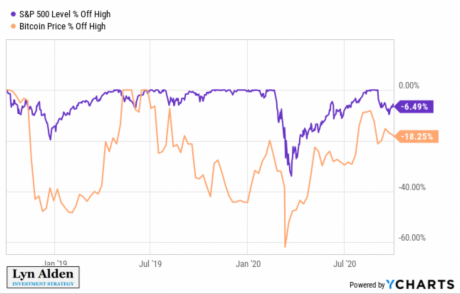
More interestingly, during bitcoin’s consolidation period, it acts a lot like digital gold.
Gold investors have long since known that the single biggest variable for gold price movements has historically been real interest rates. Real interest rates measure the difference between a “risk free” yield, like the 10-year Treasury rate, and the prevailing inflation rate or expected forward inflation rate.
Whenever real rates go lower, especially if they turn negative, gold tends to spike in price. On the other hand, when real rates rise, gold usually suffers. The period from 1980-2000 was particularly bad for gold because real rates were strongly positive for the entire duration.
This relationship is due to the opportunity cost of holding gold. Gold is a scarce but yield-less asset and has fees for minting, verifying, purchasing, transportation and secure storage. When bank accounts and Treasury bonds pay a yield much higher than the prevailing inflation rate, your purchasing power can grow within the fiat system.
On the other hand, when bank accounts and Treasury bonds no longer keep up with inflation and are being debased with negative real yields, the opportunity cost for gold vanishes. Its inherently inflation-protected “zero yield” becomes a lot more attractive.
System-wide debt and wealth concentration, unfolding in the backdrop of civil unrest and slow growth will keep pressuring policymakers to stimulate.
Over the past two years, we can see that bitcoin behaved in a similar way during its consolidation phase. This chart shows the inflation-adjusted 10-year Treasury rate in blue on the left axis and the year-over-year percent change in the price of bitcoin in red on the right axis.
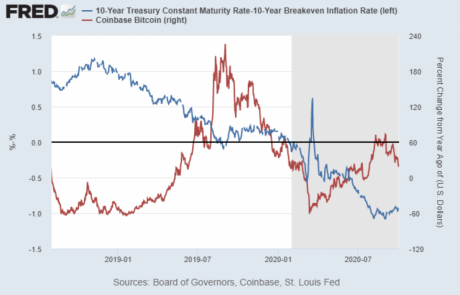
Real Treasury yields peaked in late 2018 and have been on a multi-year downtrend into negative territory. Meanwhile, bitcoin’s price has been in a volatile rebound from the depths it experienced in late 2018 and early 2019.
In this period, whenever real yields stalled or reversed upward bitcoin’s price usually would either stall or reverse downward. The same phenomenon continued into the second half of 2019 and increased sharply in March 2020 during the deflationary shock. Most recently, it has occurred gradually since the beginning of September 2020.
There are multiple reasons that real yields can change direction and it particularly depends on what part of the yield curve we are looking at. Longer-term rates are mostly controlled by the market. For instance, inflation expectations were on the uptrend this year from their March lows due to stimulus, but stalled and rolled over at the beginning of September when second-round stimulus talks weren’t going well.
Due to where we are in the long-term debt cycle and current trends of currency debasement, most of the developed world (and particularly the U.S.) is likely to experience negative real yields for its bank savers and sovereign bondholders for quite some time. This won’t be a linear process; there will likely be occasional political gridlocks on stimulus, deflationary shocks and other roadblocks, but the trend itself is almost inevitable. System-wide debt and wealth concentration, unfolding in the backdrop of civil unrest and slow growth will keep pressuring policymakers to stimulate.
Going forward, bitcoin’s price is likely to continue to be affected in the near-term by stimulus outcomes, and consequently shifts in inflation expectations and real yields. Thus, it could very well be correlated to some extent with other risk assets and inflation hedges, like stocks and precious metals.
Over the past month, fundamentals have served as a headwind for these various assets, including bitcoin, because we’ve been in one of these gridlock, counter-trend, no-stimulus, rising-real-yield periods.
However, when fundamentals turn back into a tailwind, likely due to another stimulus bill being passed and a renewed decline in real rates at some point, bitcoin likely has a lot more upside potential than similar asset classes. The network effect for the protocol remains very strong, and whenever it breaks out to new highs, momentum investors and institutional money have plenty of capacity to propel its market capitalization upwards.
Published in: Coindesk